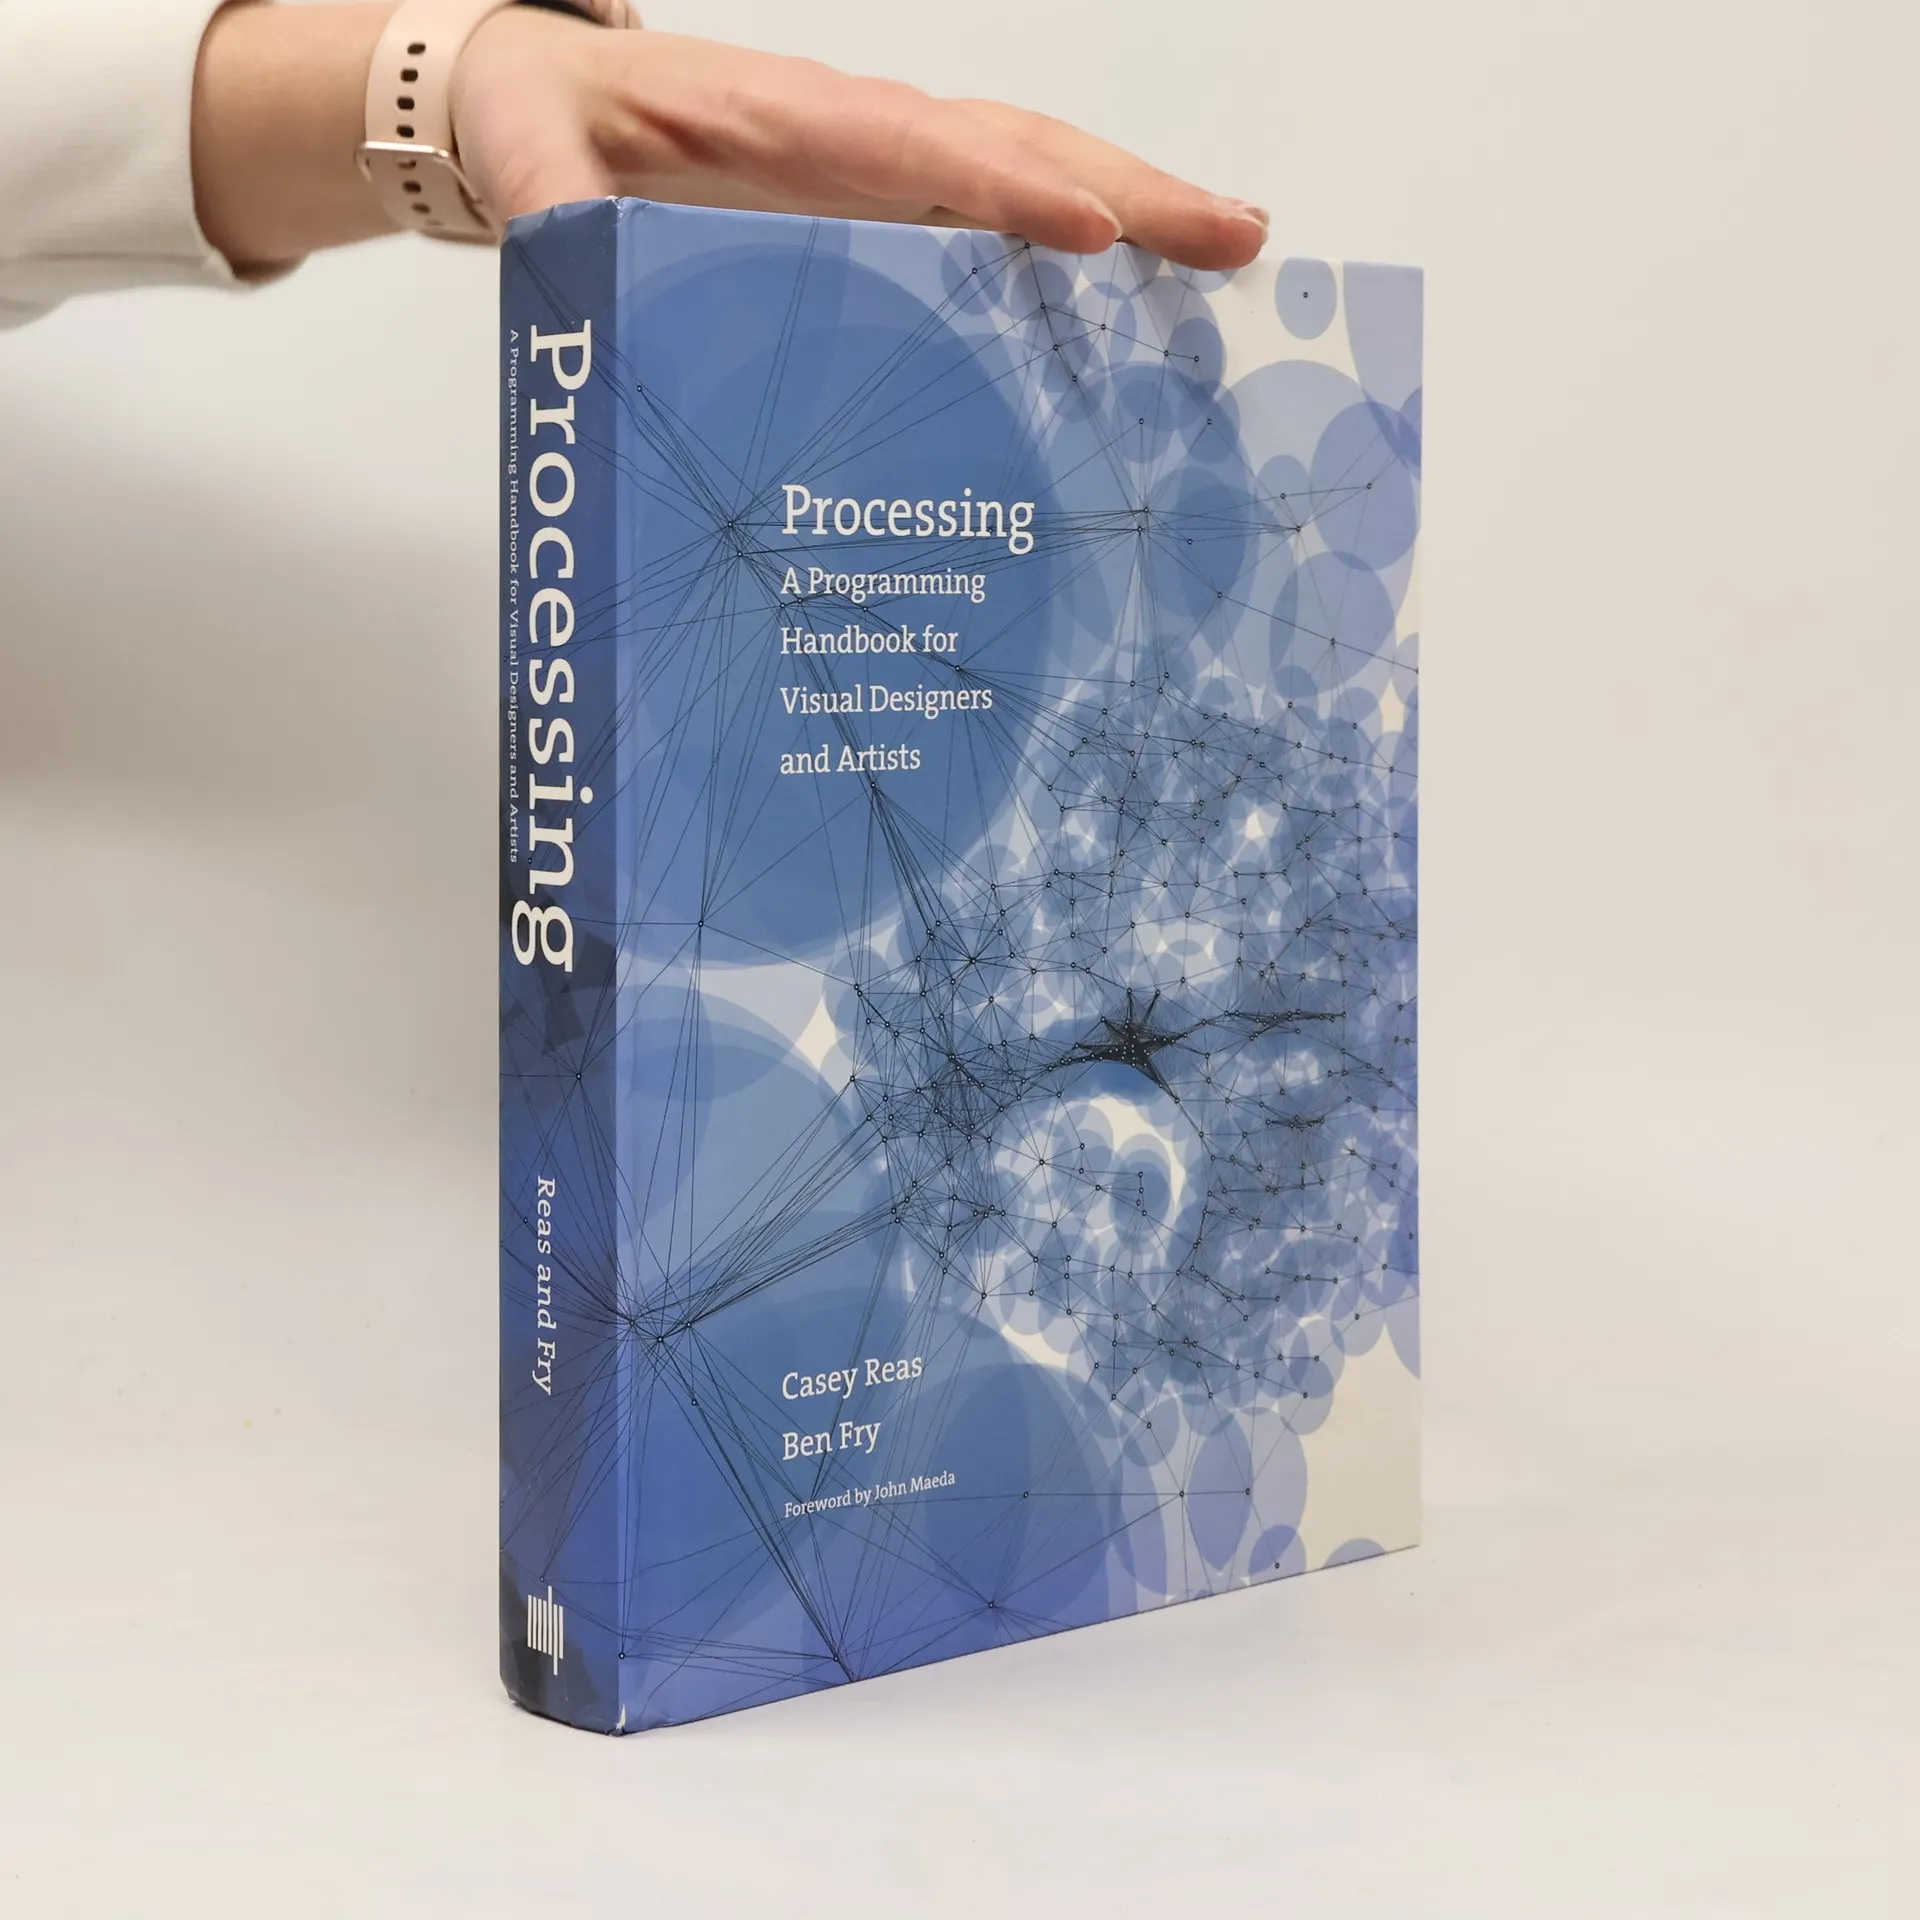
Casey Reas je profesorem designových mediálních umění na UCLA. Je také spoluautorem knihy Processing: A Programming Handbook for Visual Designers and Artists. Jeho práce se zaměřuje na vizuální umění a programování. Je známý svým přínosem v oblasti vizuálních umění a designu.
An introduction to the ideas of computer programming within the context of the visual arts that also serves as a reference and text for Processing, an open-source programming language designed for creating images, animation, and interactivity.
A single line of code offers a way to understand the cultural context of computing. This book takes a single line of code—the extremely concise BASIC program for the Commodore 64 inscribed in the title—and uses it as a lens through which to consider the phenomenon of creative computing and the way computer programs exist in culture. The authors of this collaboratively written book treat code not as merely functional but as a text—in the case of 10 PRINT, a text that appeared in many different printed sources—that yields a story about its making, its purpose, its assumptions, and more. They consider randomness and regularity in computing and art, the maze in culture, the popular BASIC programming language, and the highly influential Commodore 64 computer.
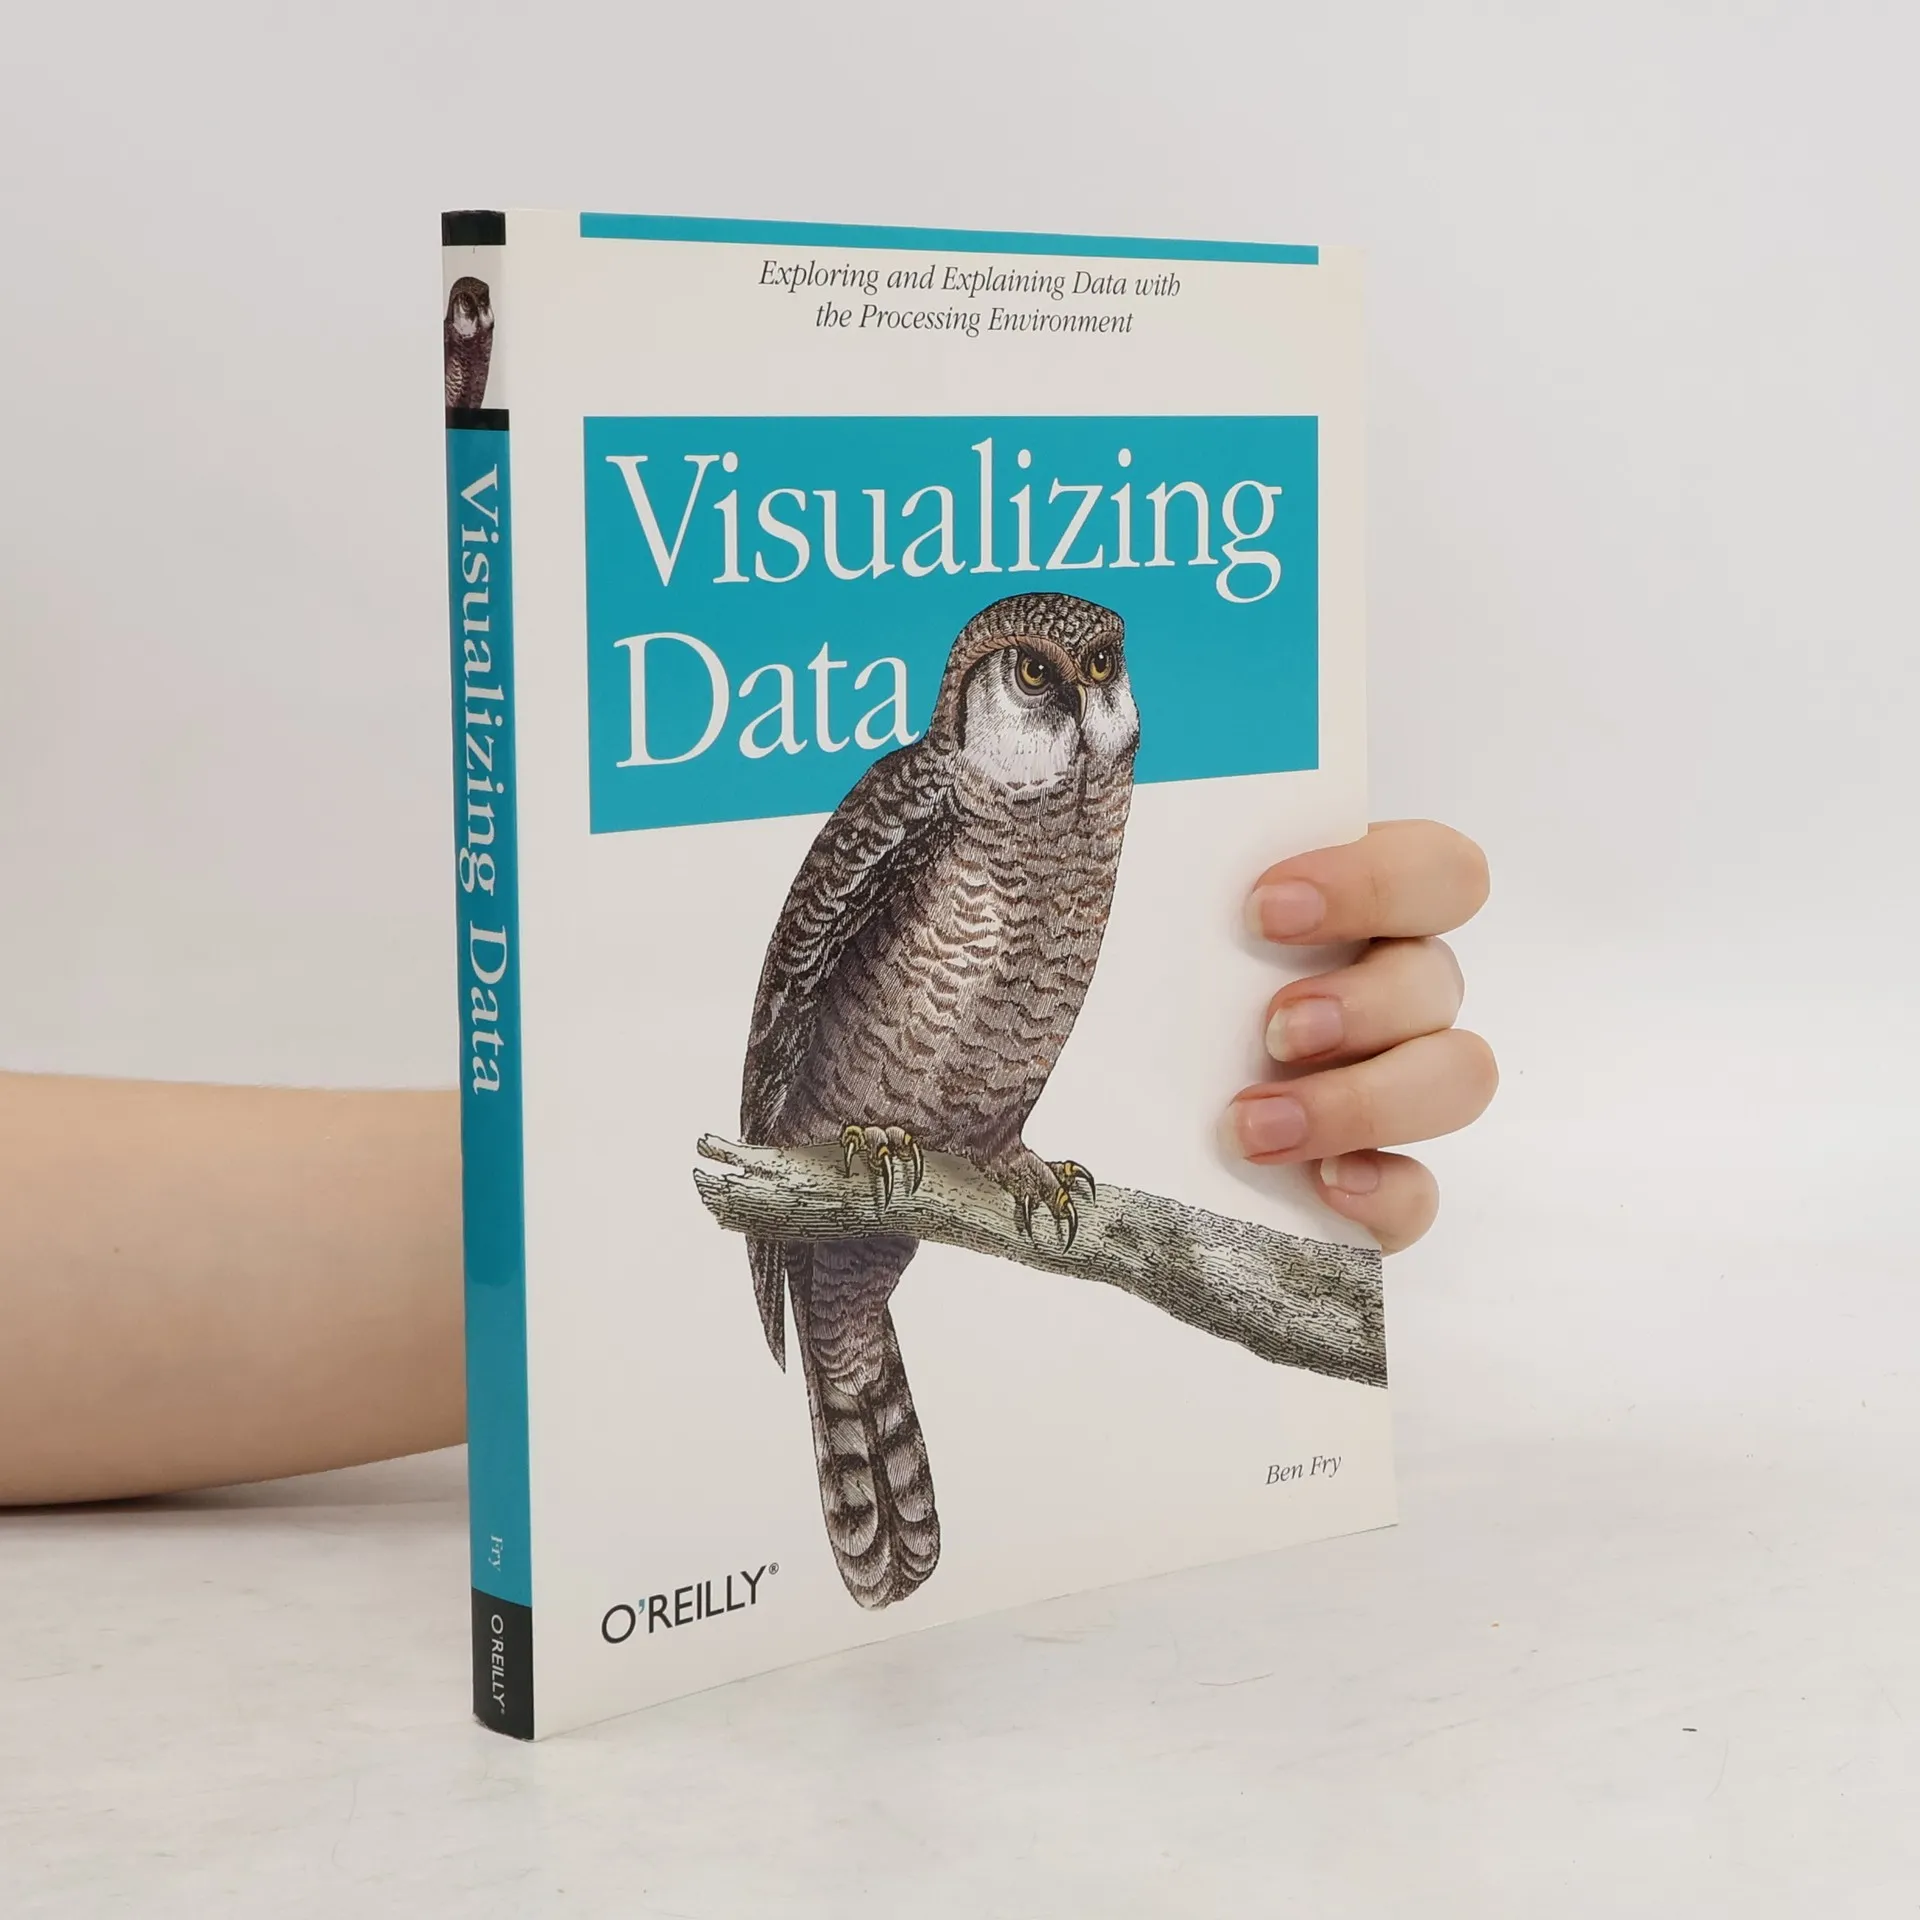
Enormous quantities of data go unused or underused, simply because people
can't visualize the quantities and relationships in it. Using a downloadable
programming environment, this book demonstrates methods for representing data
on the Web and elsewhere, complete with user interaction, animation, and more.